Laman

Tampilkan postingan dengan label android. Tampilkan semua postingan

Kamis, 06 Januari 2011

Under the hood of Google Maps 5.0 for Android

Under the hood of Google Maps 5.0 for Android

Friday, December 17, 2010 | 10:50 AM

(Cross-posted from the Official Google Blog)

Yesterday we introduced Google Maps 5.0 for Android with two significant new features: 3D interaction and offline reliability. In order to create these features, we rebuilt Maps using vector graphics to dynamically draw the map as you use it. Building a vector graphics engine capable of achieving the visual quality and performance level you expect from Google Maps was a major technical challenge and enables all sorts of future possibilities. So we wanted to give you a closer look under the hood at the technology driving the next generation of mobile maps.

Vector graphics
Before diving into how Maps uses vector graphics, it may be helpful to understand how maps were created before. Previously, Google Maps downloaded the map as sets of individual 256x256 pixel “image tiles.” Each pre-rendered image tile was downloaded with its own section of map imagery, roads, labels and other features baked right in. Google Maps would download each tile as you needed it and then stitch sets together to form the map you see. It takes more than 360 billion tiles to cover the whole world at 20 zoom levels!

Now, we use vector graphics to dynamically draw the map. Maps will download “vector tiles” that describe the underlying geometry of the map. You can think of them as the blueprints needed to draw a map, instead of static map images. Because you only need to download the blueprints, the amount of data needed to draw maps from vector tiles is drastically less than when downloading pre-rendered image tiles. Google Maps isn’t the first mobile app to use vector graphics—in fact, Google Earth and our Navigation (Beta) feature do already. But a combination of modern device hardware and innovative engineering allow us to stream vector tiles efficiently and render them smoothly, while maintaining the speed and readability we require in Google Maps. Just try it out and see for yourself!

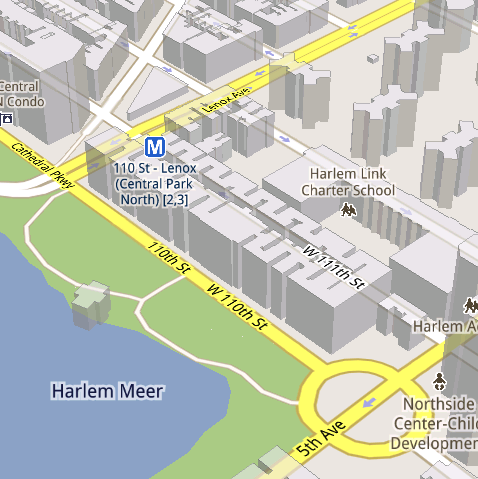
See the difference between image tiles (left) and vector tiles (right) tilted to show 3D buildings.

One map, many perspectives
Using vector tiles instead of image tiles gives Maps the flexibility to re-draw the same map from different perspectives using the same set of data. Zooming is one example of this at work. If you magnify an map image tile by 2x, lines such as roads and text would get twice as wide and appear blurry. As a result, we had to constrain Maps to 20 fixed “zoom levels,” each one twice as close as the last. Every time you zoomed in further, you’d need to download a completely new set of image tiles. It took time to load new data over a mobile data connection, and would fail when you lost your connection in a subway or large building.

Compared to image tiles (left), vector tiles (right) keep lines and labels crisp as you zoom.

With vector graphics, you no longer need to “round” to the nearest zoom level and then download all the tiles for that level. One vector tile has the underlying vector data (or blueprints) to draw the map at many different levels of scale. So when you zoom, the map stops when your fingers stop, and roads and labels always stay crisp. This same technique powers the new 3D map interactions: tilt, rotate and compass mode. Just like with zooming, Maps uses the same vector data to draw the map from any angle or direction as you tilt or rotate.

We can also display entirely new levels of detail that weren’t possible with flat image tiles. For example, in the 100+ cities where we have 3D building data, each building is drawn in 3D using a polygonal building footprint and heights for different parts of the building. And with tilt and rotate, you can see them from a variety of different angles.

Reading the map
Just like other map features, labels are dynamically drawn so they continue to face you and stay legible if you rotate the rest of the map or use compass mode. Maps also “chooses” the best labels to show you based on several factors. You’ll notice labels fade in and out as you interact with the map so that the most useful ones appear and the map never gets too cluttered.

See the difference between rotating maps with static labels (left) and dynamic labels (right).

Vector graphics also allow us to draw additional data on the map more clearly. For example, traffic or transit lines no longer block the labels beneath them. We can also draw the same map in different styles — like “satellite view” where the roads are translucent over aerial imagery, or Navigation’s “night mode” where a darker palette helps your eyes adjust quickly in the lower light.

Previously, map features like labels and traffic could conflict (left) instead of blend seamlessly (right).

Offline reliability
Vector graphics also enable another significant new feature: the ability to continue viewing maps even when you have poor—or no—network connections. Because each vector tile works across multiple zoom levels, it requires more than 100 times less data to view maps across all zoom levels than before, allowing Maps to cache much larger areas of the map on your device.

With this first version, Maps proactively caches map data for the places you use Maps the most—where you’re actively using it as well as places for which you search or get directions. Then when you’re plugged in and connected over WiFi, caching happens automatically. Near your frequent places, you’ll get detailed vector tiles for city-sized regions so you can see every road labeled. Further away, you’ll have less detail but will typically have towns and highways labeled for miles. We’re continuing to work on these algorithms, so you’ll see improvements over time.

Offline rerouting
With Google Maps Navigation (Beta), you’ll also see the benefits of additional caching with offline rerouting. This feature is only possible because Navigation caches not only map data but also data like turn restrictions for the areas surrounding your route. You’ll still need to be connected when you first start a trip to download and cache your route. But this way, even if you take a wrong turn after losing your connection, Navigation can use the cached data to get you back on your way. We will be rolling this feature out gradually over the next few weeks.

This is just the start, and we’re really excited about all the possible ways to use vector graphics technology for the next generation of Google Maps. So please stay tuned!

Update (12:47pm PST): Tweaked the description of the difference between image maps zoom levels.

A Sneak Peek of Android 3.0, Honeycomb

The past few weeks have been exciting ones for the Android team: we recently released Nexus S and Android 2.3, Gingerbread, and we’ve even had some of our most popular team members take a trip to space. But we haven’t stopped buzzing with excitement: today at the Consumer Electronic Show (CES) in Las Vegas, we previewed Android 3.0, Honeycomb.

Honeycomb is the next version of the Android platform, designed from the ground up for devices with larger screen sizes, particularly tablets. We’ve spent a lot of time refining the user experience in Honeycomb, and we’ve developed a brand new, truly virtual and holographic user interface. Many of Android’s existing features will really shine on Honeycomb: refined multi-tasking, elegant notifications, access to over 100,000 apps on Android Market, home screen customization with a new 3D experience and redesigned widgets that are richer and more interactive. We’ve also made some powerful upgrades to the web browser, including tabbed browsing, form auto-fill, syncing with your Google Chrome bookmarks, and incognito mode for private browsing.

Honeycomb also features the latest Google Mobile innovations including Google Maps 5 with 3D interactions and offline reliability, access to over 3 million Google eBooks, and Google Talk, which now allows you to video and voice chat with any other Google Talk enabled device (PC, tablet, etc).

Please stay tuned for more Honeycomb news from the Android team. For now, you can get a taste of Honeycomb by checking out this video.

Minggu, 02 Januari 2011

android in space

Here at Google, we’re all about exploration. It’s no surprise that some of our favorite products are built to let you explore the world in ways never before possible. Google Maps lets you find your way all around the world. Google Earth lets you explore the planet in detail, complete with trees and oceans. And Google Sky Map lets you explore the skies right from your Android device. Well, we wanted to do a little exploring of our own, so we decided to venture into near space, with the help of some Androids.

Recently, we travelled to Ione, CA and sent seven payloads up, up, and away into near space, each equipped with a Nexus S. We took some cues from others who have sent homemade weather balloon rigs far up, and we wanted an opportunity to collect some interesting data about the sensors in Nexus S – GPS, gyroscope, accelerometer, and magnetometer. We also couldn’t resist what looked like a great way to spend a weekend. Sending the balloons up also gave us an opportunity to capture some stunning imagery and videos of Earth. Take a look at unaltered footage of an Android at over 100,000 ft above the Earth’s surface:

The Rig
How did we get our little Android commanders that high up? Well, first the Android platform provides a robust development environment and Nexus S has a great set of embedded sensors, both of which made it easy for us to write the apps we needed for this project. Going forward with other similar projects we have an open environment that we can modify at any level necessary. We then worked with UCSC student Greg Klein to prepare each of the payloads, which were housed in foam coolers. We secured a nylon load line to the cooler and attached to it a radar reflector, a parachute, and finally, a weather balloon. Every payload had an APRS transmitter attached to a GPS that was known to work at high altitudes, as well as batteries for power. The remainder of each payload was different for each balloon: some had digital cameras taking pictures and some had video cameras mounted at various angles (up, down, and at the horizon).

These phones were running a variety of apps: Google Maps for Mobile 5.0 (with offline map data) which allowed us to see what was directly below the balloon, Google Sky Map to see if we could identify the real stars in the backdrop, Latitude to report location when the phones had a data connection, and our own custom sensor logging app that sampled all the available sensors on the device. We even manned our payloads with some special astronauts: small Android robots, and boy did they fly. Check out an in-depth look at how we prepared and launched the payloads: